Power and sectoral balances
Robin Wigglesworth writes in yesterday's FT on the IMF's Global Financial Stability Report. I was struck by this chart, which shows global indebtedness by sector:
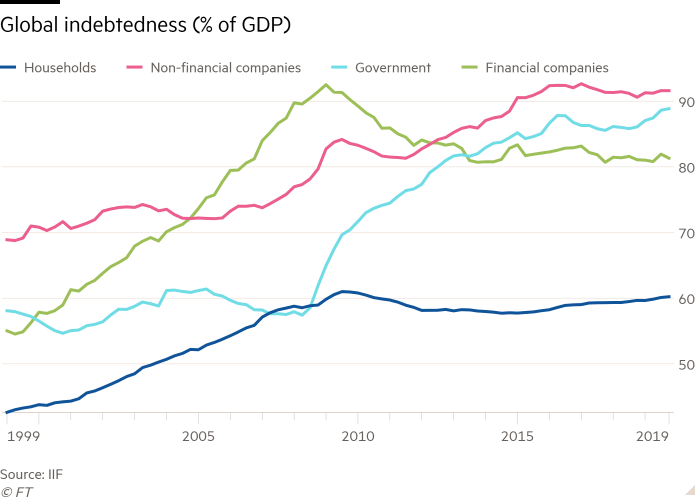
The chart reflects something of a sectoral-balances approach to understanding the global economy: global financial flows can be grouped according to the type of entities involved. This particular chart focuses on grouping borrowers, helpfully aggregated over the entire globe. Here they grouped into households, government, finance and non-financial business.
The point emphasized in the article is simply that corporations are entering the COVID-19 economic disruption with greater indebtedness than they entered the 2008 global credit crisis.
15 April 2020